““If a machine is down for a certain amount of time, a message is sent directly to the supervisor. If it is down longer, it is escalated to a manager and so forth. The information is visible and available on shop floor machine terminals, large TV screens, and can send notifications up the chain of command”.”
-Patrick Kealey
Senior Director – PT at Benchmark
“We needed a way to figure out how our machines were cutting, and we needed raw data to help us understand what was happening on the shop floor”
-Marzel Neckien
Owner W Machine Works Inc.
What is Machine Data?
John Lucier and Tony Gunn speak on Smart Machine Monitoring and FactoryWiz Capabilities.
Want to know how our customers tend to see an immediate 15% increase in efficiency?
Please fill out the form and a FactoryWiz representative will reach out within 24 hours.
Modern Ethernet enabled Machines and Legacy Equipment
FactoryWiz has one of the largest machine connection libraries in the industry. While most newer equipment utilize industry standard connections such as Fanuc Focus, MT Connect or OPC-UA, FactoryWiz also excels at hooking up to older equipment that was never designed to be monitored.
CNC Machines – Additive Machines – Robots – Fabrication Equip – Furnaces – Compressors – Process PLC’s – Other shop assets…
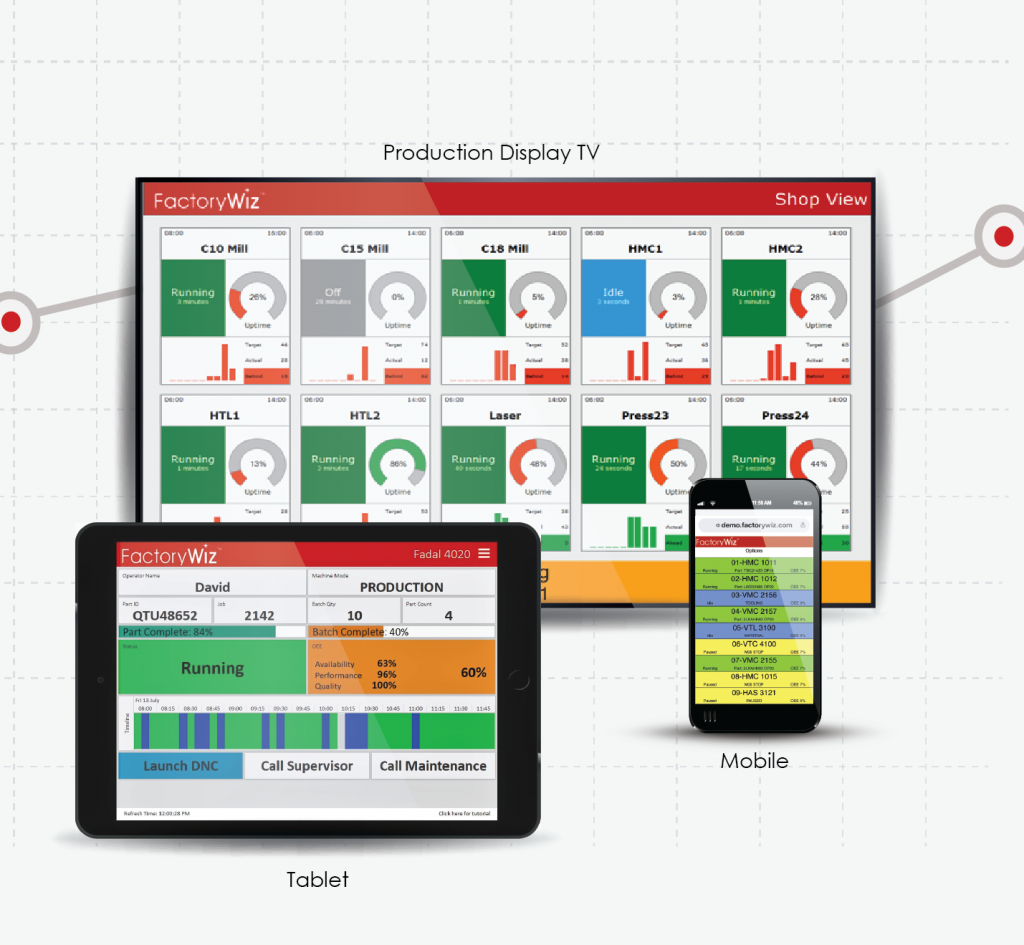
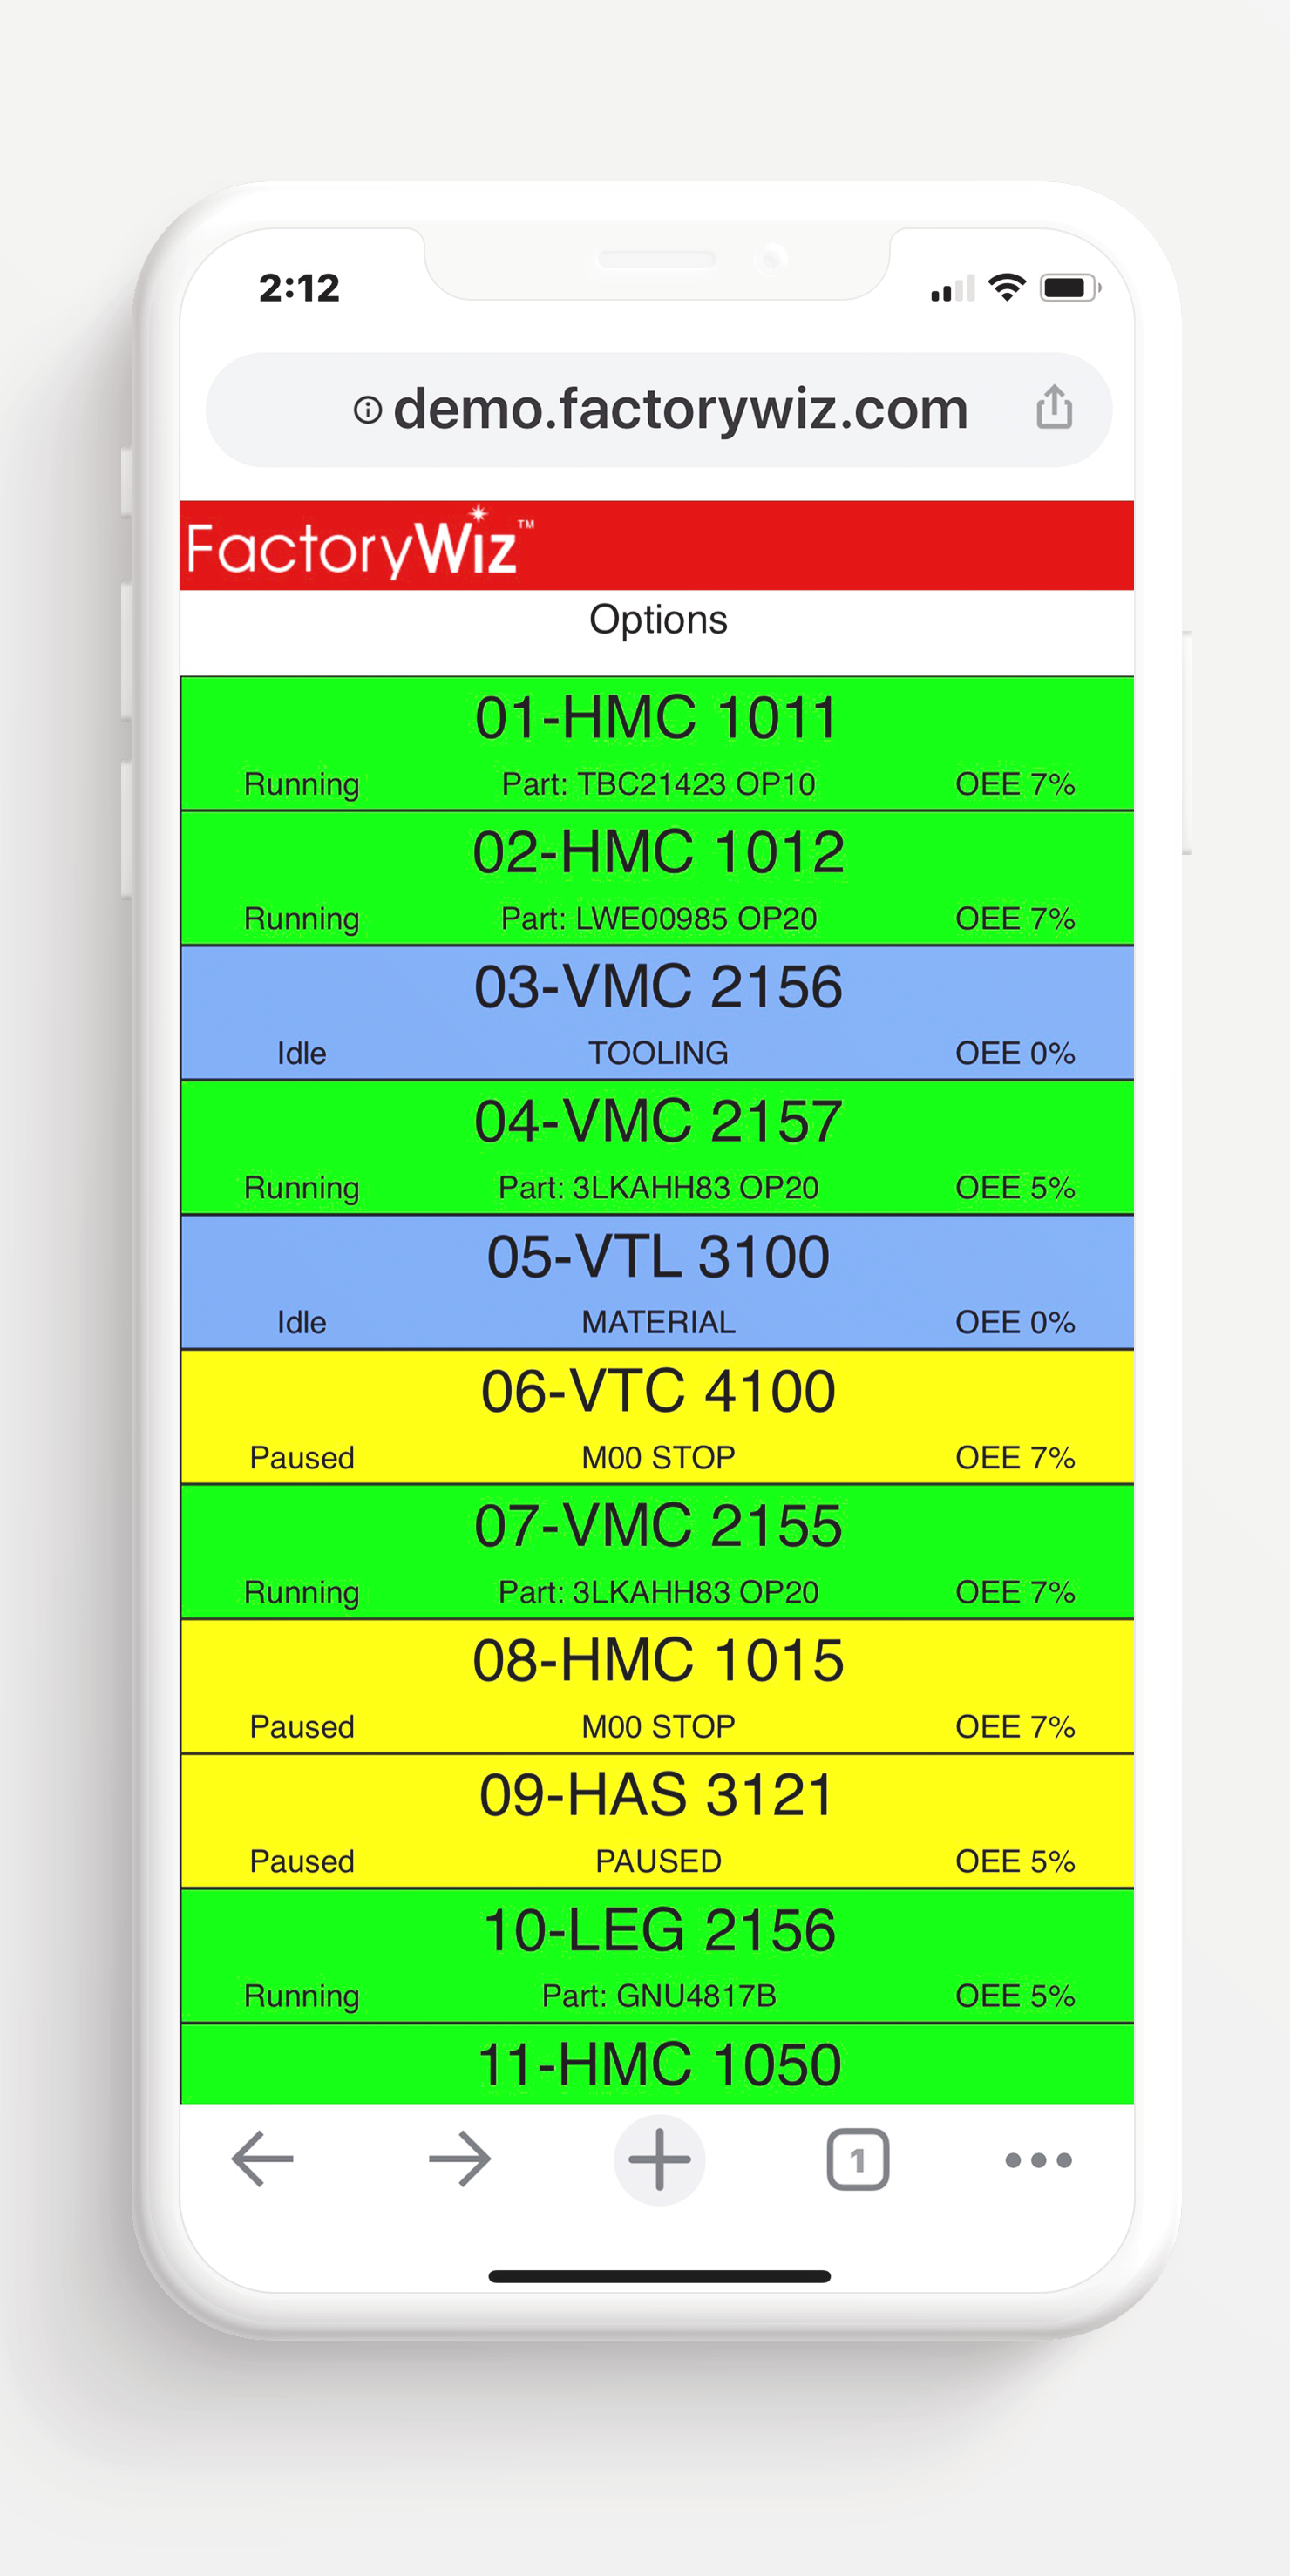
Visualize critical live machine data in real-time via interactive dashboards, charts, graphs, e-mails and text messages from any web enabled device.
If your machine enters into an alarm state you can receive a text message or e-mail letting you know the machine is idle due to an alarm or other variable watch.
FactoryWiz connects great to custom data exchange applications. The system comes with a complete .NET API encompassing everything that the system does internally.
Front line managers receive live insight to streamline workflow/operations and executives can analyze historical report metrics online, on demand, or via scheduled e-mails.
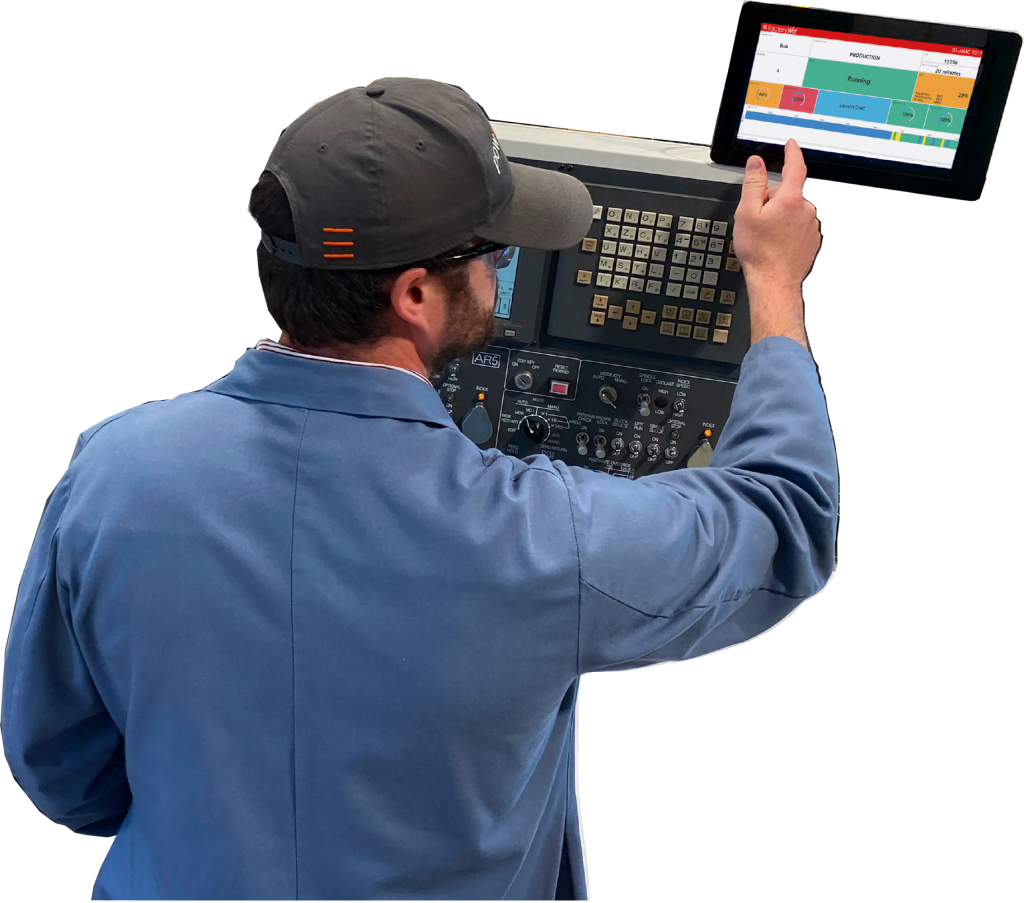
The primary function of the Operator Tablet or PC is for bidirectional exchange of information. FactoryWiz Monitoring automatically time stamps all activity. The only thing it does not know is “why” the machine is idle for extended period time. When this happens, we rely on operators to input the “why” reasons. When a stoppage event occurs, the tablet or PC automatically presents a list of user defined downtime reasons in large easy to use buttons. Once the reason is identified, the tablet/PC returns to normal mode where the operator can view current work status, download DNC programs, and ask for assistance from supervisors, maintenance, programming, etc.
The new Flexible Tablet Interface allows customers to easily customize the User Interface to their specific requirements. Tablet and PC displays are subjective and rather than make a unique build for each customer, FactoryWiz developed a widget-based system where users can customize look and feel by adding and sizing widgets from a select list. Once defined, templates can be saved and later used for single applications or multiple groups of machines or processes.
Previous
Next
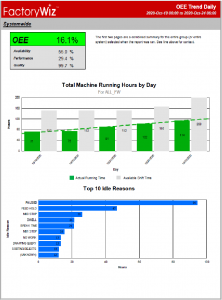
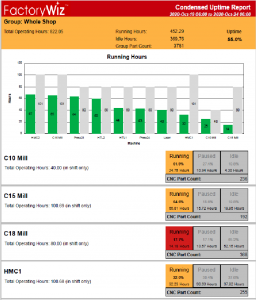
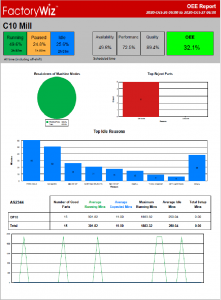
FactoryWiz Monitoring has several helpful pre-defined reports to track productivity. Compare collected information based on shift, job number, part number, parts produced, individual machine or machine groups/department. All reports are open and customizable using Crystal Reports, Power BI, or export to Excel.
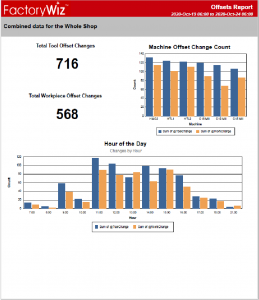
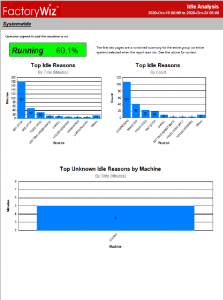
Included available reports also break down common idle reasons, alarms and alarm messages messages, and tool and workpiece offsets showing old and new values along with the timestamp of the change. FactoryWiz reports can be generated on demand as well as automatically e-mailed at user defined intervals using predefined settings and filters.