Machine Monitoring: Whats the difference between OEE & TEEP?
In the world of Machine Monitoring, many want to know, what’s the difference between OEE & TEEP, and how do I apply these metrics to improve shop floor efficiency. Many metrics are used to help improve productivity and efficiency, and being able to easily visualize that data is what makes FactoryWiz Monitoring so valuable. We take a look at the differences between OEE (overall equipment effectiveness) and TEEP (Total Effective Equipment Performance).
OEE
OEE = Availability x Performance x Quality
A = Run time / Planned production time
P = Planned run time / Actual run time
Q = Good count / Total count
OEE is calculated by multiplying the three OEE factors: Availability, Performance and Quality.
Overall Equipment Effectiveness (OEE) is a common acronym in the manufacturing world, yet many fail to understand what it means and how it can be applied. OEE measures the percentage of planned production time that is truly productive. OEE can help you see and measure problems so you can fix it, and gives a standardized procedure to gauge progress.
OEE is made up of three metrics, that when combined, give you a complete overview of production. Before figuring out your OEE score, it’s important to have all your ducks in a row, and start by tackling availability. For instance, use this report to identify persistent downtime reasons and take the necessary corrective action to eliminate them.
The goal is to improve the three metrics (A, P, Q) one by one for an overall increase in OEE. OEE can be a very helpful measurement on the shop floor to help detect potential losses and understand where your processes are failing. Our OEE report and productivity dashboard can be vital for gaining a better understanding of problems as they develop over time.
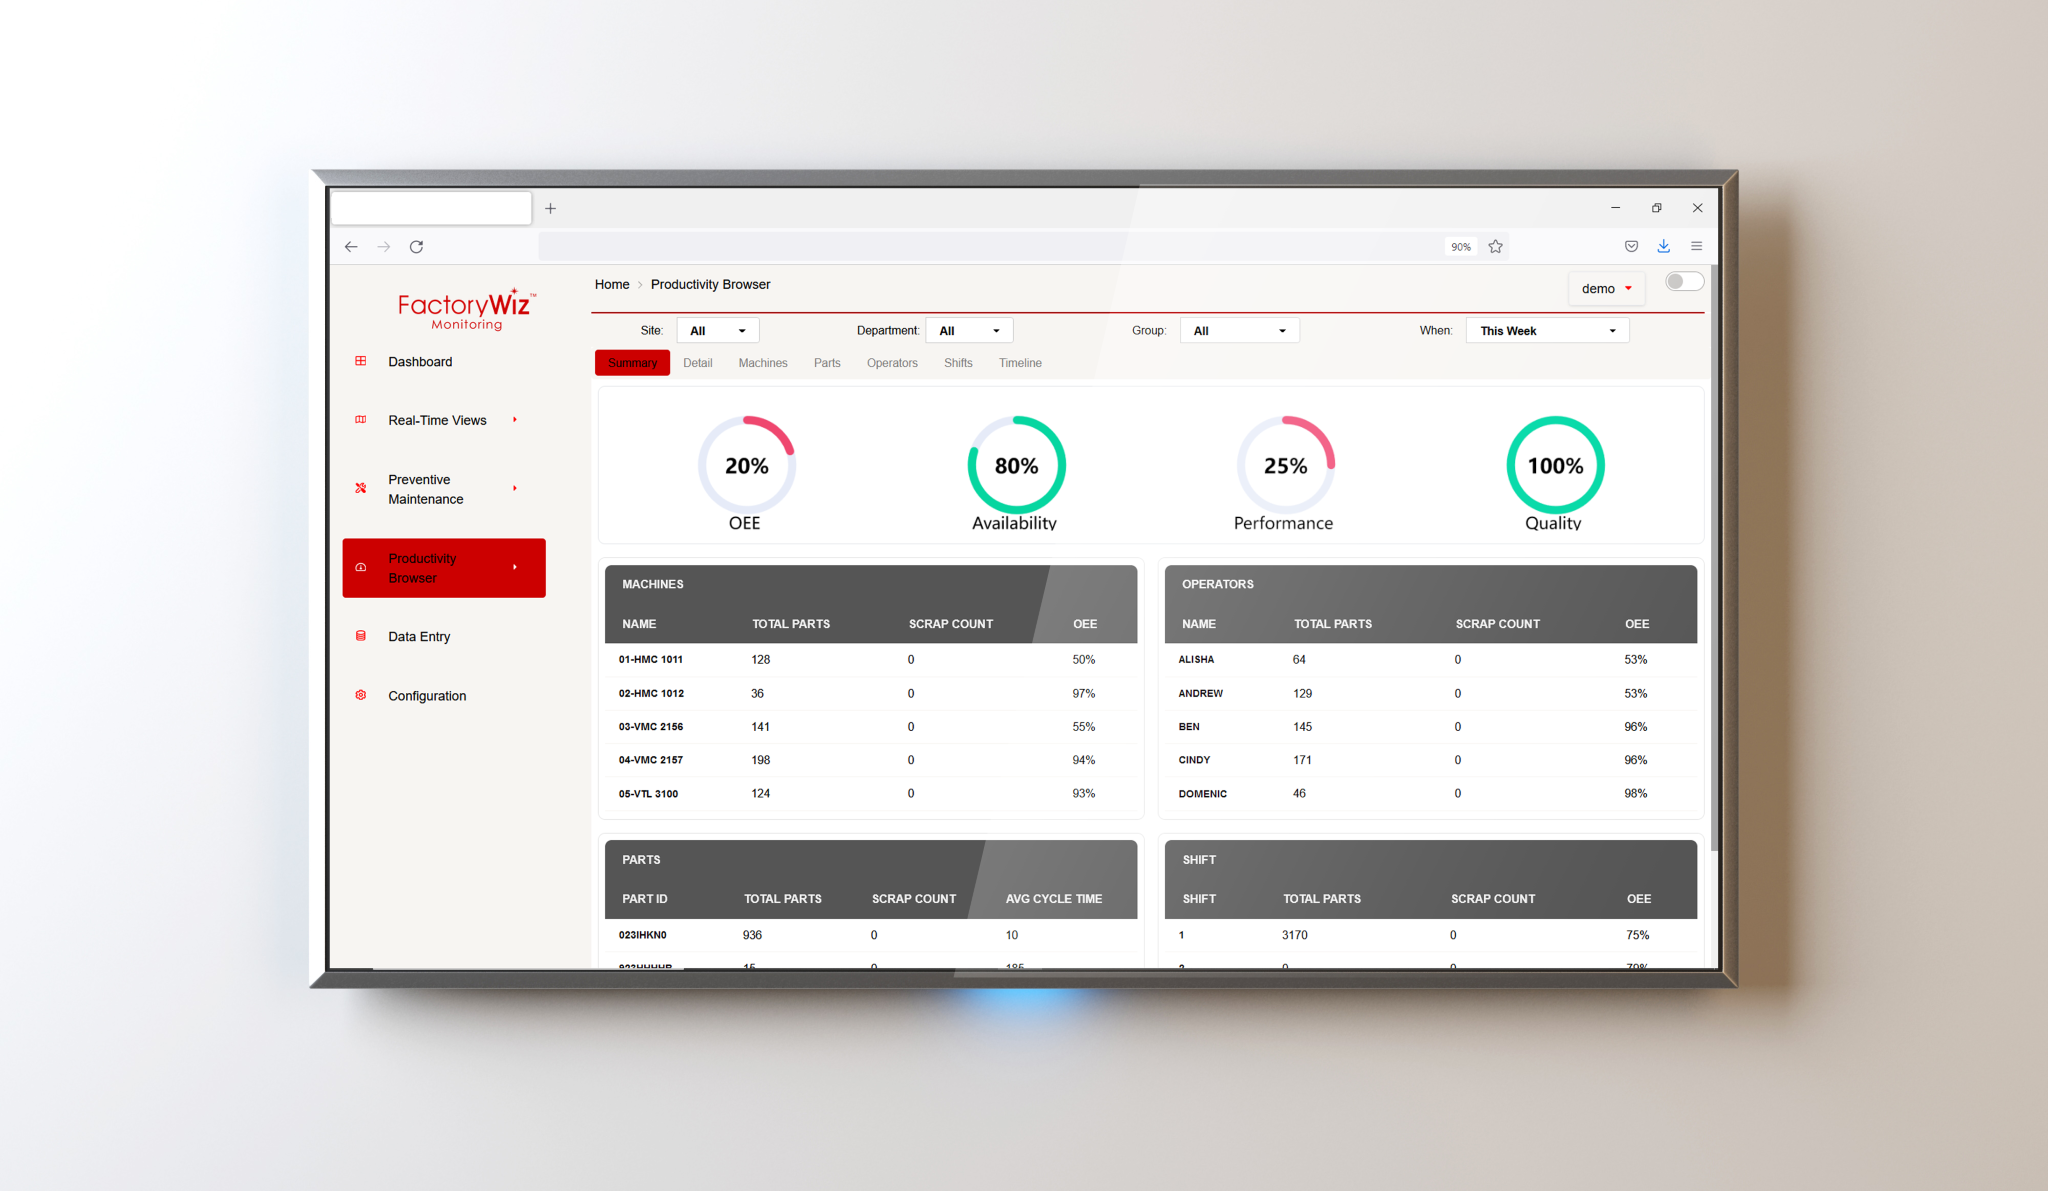
FactoryWiz Monitoring 2023 Productivity Browser
TEEP
OEE = Availability x Performance x Quality
TEEP = OEE x Utilization
U = Planned production time / All time
TEEP is calculcated by multiplying four factors: Availability, Performance, Quality and Utilization
Total Effective Equipment Performance (TEEP) is a performance metric that provides insights as to the true capacity of your manufacturing operation. It takes into account both Equipment Losses (as measured by OEE) and Schedule Losses (as measured by Utilization). TEEP calculates how much capacity is waiting to be utilized, and in other words, shows potential for increased throughput with your current equipment.
TEEP makes you look at productivity improvements and shows where you can recover lost opportunities you didn’t even know existed. Correctly utilizing our new TEEP report can be key to understanding how to maximize efficiency and productivity on the shop floor.
The updated FactoryWiz Monitoring reports give shop floor managers and operators an unbiased view of shop floor performance. With several helpful pre-defined reports to track productivity, you can also compare collected information based on shift, job number, part number, parts produced, individual machine or machine groups/department. All reports are open and customizable using Crystal Reports, Power BI, or export to Excel.
Included available reports also break down common idle reasons, alarms and alarm messages, and tool and workpiece offsets showing old and new values along with the timestamp of the change. FactoryWiz reports can be generated on demand as well as automatically e-mailed at user defined intervals using predefined settings and filters.
When do you need these reports? Receive alert notifications and reports on any web enabled device. Requested Reports, Alarms, Part Count, Machine Conditions, Machine Maintenance schedules and more.